A Handbook of Statistical Analyses Using R — 3rd Edition
Chapter 1 An Introduction to R
1.1 What is R?
The R system for statistical computing is an environment for data analysis and graphics. The root of R is the S language, developed by John Chambers and colleagues (Becker et al., 1988, Chambers and Hastie, 1992, Chambers, 1998) at Bell Laboratories (formerly AT&T, now owned by Lucent Technologies) starting in the 1960s. The S language was designed and developed as a programming language for data analysis tasks but in fact it is a full-featured programming language in its current implementations.
The development of the R system for statistical computing is heavily influenced by the open source idea: The base distribution of R and a large number of user-contributed extensions are available under the terms of the Free Software Foundation’s GNU General Public License in source code form. This licence has two major implications for the data analyst working with R. The complete source code is available and thus the practitioner can investigate the details of the implementation of a special method, make changes, and distribute modifications to colleagues. As a side effect, the R system for statistical computing is available to everyone. All scientists, including, in particular, those working in developing countries, now have access to state-of-the-art tools for statistical data analysis without additional costs. With the help of the R system for statistical computing, research really becomes reproducible when both the data and the results of all data analysis steps reported in a paper are available to the readers through an R transcript file. R is most widely used for teaching undergraduate and graduate statistics classes at universities all over the world because students can freely use the statistical computing tools.
The base distribution of R is maintained by a small group of statisticians, the R Development Core Team. A huge amount of additional functionality is implemented in add-on packages authored and maintained by a large group of volunteers. The main source of information about the R system is the World Wide Web with the official home page of the R project being
All resources are available from this page: the R system itself, a collection of add-on packages, manuals, documentation, and more.
The intention of this chapter is to give a rather informal introduction to basic concepts and data manipulation techniques for the R novice. Instead of a rigid treatment of the technical background, the most common tasks are illustrated by practical examples and it is our hope that this will enable readers to get started without too many problems.
1.2 Installing R
The R system for statistical computing consists of two major parts: the base system and a collection of user-contributed add-on packages. The R language is implemented in the base system. Implementations of statistical and graphical procedures are separated from the base system and are organized in the form of packages. A package is a collection of functions, examples, and documentation. The functionality of a package is often focused on a special statistical methodology. Both the base system and packages are distributed via the Comprehensive R Archive Network (CRAN) accessible under
1.2.1 The Base System and the First Steps
The base system is available in source form and in precompiled form for various Unix systems, Windows platforms and Mac OS X. For the data analyst, it is sufficient to download the precompiled binary distribution and install it locally. Windows users follow the link
https://CRAN.R-project.org/bin/windows/base/release.htm
download the corresponding file (currently named rw4062.exe), execute it locally, and follow the instructions given by the installer.

Depending on the operating system, R can be started either by typing ‘R’ on the shell (Unix systems) or by clicking on the R symbol (as shown left) created by the installer (Windows). R comes without any frills and on start up shows simply a short introductory message including the version number and a prompt ‘>’:
R : Copyright 2026 The R Foundation for Statistical ComputingVersion 4.6.2 (2026-10-29), ISBN 3-900051-07-0R is free software and comes with ABSOLUTELY NO WARRANTY.You are welcome to redistribute it under certain conditions.Type 'license()' or 'licence()' for distribution details.R is a collaborative project with many contributors.Type 'contributors()' for more information and'citation()' on how to cite R or R packages in publications.Type 'demo()' for some demos, 'help()' for on-line help, or'help.start()' for an HTML browser interface to help.Type 'q()' to quit R.>One can change the appearance of the prompt by
> options(prompt = "R> ")and we will use the prompt R> for the display of the code examples throughout this book. A + sign at the very beginning of a line indicates a continuing command after a newline.
Essentially, the R system evaluates commands typed on the R prompt and returns the results of the computations. The end of a command is indicated by the return key. Virtually all introductory texts on R start with an example using R as a pocket calculator, and so do we:
R> x <- sqrt(25) + 2This simple statement asks the R interpreter to calculate and then to add . The result of the operation is assigned to an R object with variable name x. The assignment operator <- binds the value of its right-hand side to a variable name on the left-hand side. The value of the object x can be inspected simply by typing
R> x
[1] 7which, implicitly, calls the print method:
R> print(x)
[1] 7
1.2.2 Packages
The base distribution already comes with some high-priority add-on packages, namely
| KernSmooth | MASS | Matrix | class |
| cluster | codetools | lattice | nlme |
| nnet | rpart | survival | boot |
| foreign | mgcv | spatial | base |
| compiler | datasets | grDevices | graphics |
| grid | methods | parallel | splines |
| stats | stats4 | tcltk | tools |
| utils |
Some of the packages listed here implement standard statistical functionality, for example linear models, classical tests, a huge collection of high-level plotting functions or tools for survival analysis; many of these will be described and used in later chapters. Others provide basic infrastructure, for example for graphic systems, code analysis tools, graphical-user interfaces or other utilities.
Packages not included in the base distribution can be installed directly from the R prompt. At the time of writing this chapter, user-contributed packages covering almost all fields of statistical methodology were available. Certain so-called ‘task views’ for special topics, such as statistics in the social sciences, environmetrics, robust statistics, etc., describe important and helpful packages and are available from
Given that an Internet connection is available, a package is installed by supplying the name of the package to the function install.packages. If, for example, add-on functionality for robust estimation of covariance matrices via sandwich estimators is required (for example in Chapter 13), the sandwich package (Zeileis, 2004) can be downloaded and installed via
R> install.packages("sandwich")The package functionality is available after attaching the package by
R> library("sandwich")A comprehensive list of available packages can be obtained from
https://CRAN.R-project.org/web/packages/
Note that on Windows operating systems, precompiled versions of packages are downloaded and installed. In contrast, packages are compiled locally before they are installed on Unix systems.
1.3 Help and Documentation
Roughly, three different forms of documentation for the R system for statistical computing may be distinguished: online help that comes with the base distribution or packages, electronic manuals, and publications work in the form of books, etc.
The help system is a collection of manual pages describing each user-visible function and data set that comes with R. A manual page is shown in a pager or Web browser when the name of the function we would like to get help for is supplied to the help function
R> help("mean")or, for short,
R> ?meanEach manual page consists of a general description, the argument list of the documented function with a description of each single argument, information about the return value of the function and, optionally, references, cross-links and, in most cases, executable examples. The function help.search is helpful for searching within manual pages. An overview on documented topics in an add-on package is given, for example for the sandwich package, by
R> help(package = "sandwich")Often a package comes along with an additional document describing the package functionality and giving examples. Such a document is called a vignette (Leisch, 2003, Gentleman, 2005). For example, the sandwich package vignette is opened using
R> vignette("sandwich", package = "sandwich")
More extensive documentation is available electronically from the collection of manuals at
https://CRAN.R-project.org/manuals.html
For the beginner, at least the first and the second document of the following four manuals (R Development Core Team, 2014a, R Development Core Team, 2014b, R Development Core Team, 2014c, R Development Core Team, 2014d) are mandatory:
- An Introduction to R
-
A more formal introduction to data analysis with R than this chapter.
- R Data Import/Export
-
A very useful description of how to read and write various external data formats.
- R Installation and Administration
-
Hints for installing R on special platforms.
- Writing R Extensions
-
The authoritative source on how to write R programs and packages.
Both printed and online publications are available, the most important ones are Modern Applied Statistics with S (Venables and Ripley, 2002), Introductory Statistics with R (Dalgaard, 2002), R Graphics (Murrell, 2005) and the R Newsletter, freely available from
https://CRAN.R-project.org/doc/Rnews/
In case the electronically available documentation and the answers to frequently asked questions (FAQ), available from
https://CRAN.R-project.org/faqs.html
have been consulted but a problem or question remains unsolved, the r-help email list is the right place to get answers to well-thought-out questions. It is helpful to read the posting guide
https://www.R-project.org/posting-guide.html
before starting to ask.
1.4 Data Objects in R
The data handling and manipulation techniques explained in this chapter will be illustrated by means of a data set of world leading companies, the Forbes 2000 list for the year 2004 collected by Forbes Magazine. This list is originally available from
and, as an R data object, it is part of the HSAUR3 package (Source: From Forbes.com, New York, New York, 2004. With permission.). In a first step, we make the data available for computations within R. The data function searches for data objects of the specified name ("Forbes2000") in the package specified via the package argument and, if the search was successful, attaches the data object to the global environment:
R> data("Forbes2000", package = "HSAUR3")R> ls()
[1] "x" "Forbes2000"The output of the ls function lists the names of all objects currently stored in the global environment, and, as the result of the previous command, a variable named Forbes2000 is available for further manipulation. The variable x arises from the pocket calculator example in Subsection 1.2.1.
As one can imagine, printing a list of companies via
R> print(Forbes2000)
rank name country category sales1 1 Citigroup United States Banking 94.712 2 General Electric United States Conglomerates 134.193 3 American Intl Group United States Insurance 76.66 profits assets marketvalue1 17.85 1264.03 255.302 15.59 626.93 328.543 6.46 647.66 194.87
...will not be particularly helpful in gathering some initial information about the data; it is more useful to look at a description of their structure found by using the following command
R> str(Forbes2000)
'data.frame':2000 obs. of 8 variables: $ rank : int 1 2 3 4 5 ... $ name : chr "Citigroup" "General Electric" ... $ country : Factor w/ 61 levels "Africa","Australia",... $ category : Factor w/ 27 levels "Aerospace & defense",.. $ sales : num 94.7 134.2 ... $ profits : num 17.9 15.6 ... $ assets : num 1264 627 ... $ marketvalue: num 255 329 ...The output of the str function tells us that Forbes2000 is an object of class data.frame, the most important data structure for handling tabular statistical data in R. As expected, information about observations, i.e., companies, are stored in this object. For each observation, the following eight variables are available:
- rank
-
the ranking of the company,
- name
-
the name of the company,
- country
-
the country the company is situated in,
- category
-
a category describing the products the company produces,
- sales
-
the amount of sales of the company in billion US dollars,
- profits
-
the profit of the company in billion US dollars,
- assets
-
the assets of the company in billion US dollars,
- marketvalue
-
the market value of the company in billion US dollars.
A similar but more detailed description is available from the help page for the Forbes2000 object:
R> help("Forbes2000")or
R> ?Forbes2000All information provided by str can be obtained by specialized functions as well and we will now have a closer look at the most important of these.
The R language is an object-oriented programming language, so every object is an instance of a class. The name of the class of an object can be determined by
R> class(Forbes2000)
[1] "data.frame"Objects of class data.frame represent data the traditional table-oriented way. Each row is associated with one single observation and each column corresponds to one variable. The dimensions of such a table can be extracted using the dim function
R> dim(Forbes2000)
[1] 2000 8Alternatively, the numbers of rows and columns can be found using
R> nrow(Forbes2000)
[1] 2000
R> ncol(Forbes2000)
[1] 8The results of both statements show that Forbes2000 has rows, i.e., observations, the companies in our case, with eight variables describing the observations. The variable names are accessible from
R> names(Forbes2000)
[1] "rank" "name" "country" "category"[5] "sales" "profits" "assets" "marketvalue"The values of single variables can be extracted from the Forbes2000 object by their names, for example the ranking of the companies
R> class(Forbes2000[,"rank"])
[1] "integer"is stored as an integer variable. Brackets [] always indicate a subset of a larger object, in our case a single variable extracted from the whole table. Because data.frames have two dimensions, observations and variables, the comma is required in order to specify that we want a subset of the second dimension, i.e., the variables. The rankings for all companies are represented in a vector structure the length of which is given by
R> length(Forbes2000[,"rank"])
[1] 2000A vector is the elementary structure for data handling in R and is a set of simple elements, all being objects of the same class. For example, a simple vector of the numbers one to three can be constructed by one of the following commands
R> 1:3
[1] 1 2 3
R> c(1,2,3)
[1] 1 2 3
R> seq(from = 1, to = 3, by = 1)
[1] 1 2 3
The unique names of all companies are stored in a character vector
R> class(Forbes2000[,"name"])
[1] "character"
R> length(Forbes2000[,"name"])
[1] 2000and the first element of this vector is
R> Forbes2000[,"name"][1]
[1] "Citigroup"Because the companies are ranked, Citigroup is the world’s largest company according to the Forbes 2000 list. Further details on vectors and subsetting are given in Section 1.6.
Nominal measurements are represented by factor variables in R, such as the category of the company’s business segment
R> class(Forbes2000[,"category"])
[1] "factor"Objects of class factor and character basically differ in the way their values are stored internally. Each element of a vector of class character is stored as a character variable whereas an integer variable indicating the level of a factor is saved for factor objects. In our case, there are
R> nlevels(Forbes2000[,"category"])
[1] 27different levels, i.e., business categories, which can be extracted by
R> levels(Forbes2000[,"category"])
[1] "Aerospace & defense"[2] "Banking"[3] "Business services & supplies"
...As a simple summary statistic, the frequencies of the levels of such a factor variable can be found from
R> table(Forbes2000[,"category"])
Aerospace & defense Banking 19 313Business services & supplies 70
...
The sales, assets, profits, and market value variables are of type numeric, the natural data type for continuous or discrete measurements, for example
R> class(Forbes2000[,"sales"])
[1] "numeric"and simple summary statistics such as the mean, median, and range can be found from
R> median(Forbes2000[,"sales"])
[1] 4.365
R> mean(Forbes2000[,"sales"])
[1] 9.69701
R> range(Forbes2000[,"sales"])
[1] 0.01 256.33The summary method can be applied to a numeric vector to give a set of useful summary statistics, namely the minimum, maximum, mean, median, and the and quartiles; for example
R> summary(Forbes2000[,"sales"])
Min. 1st Qu. Median Mean 3rd Qu. Max. 0.010 2.018 4.365 9.697 9.547 256.330
1.5 Data Import and Export
In the previous section, the data from the Forbes 2000 list of the world’s largest companies were loaded into R from the HSAUR3 package but we will now explore practically more relevant ways to import data into the R system. The most frequent data formats the data analyst is confronted with are comma separated files, Excel spreadsheets, files in SPSS format and a variety of SQL data base engines. Querying data bases is a nontrivial task and requires additional knowledge about querying languages, and we therefore refer to the R Data Import/Export manual – see Section 1.3. We assume that a comma-separated file containing the Forbes 2000 list is available as Forbes2000.csv (such a file is part of the HSAUR3 source package in directory HSAUR3/inst/rawdata). When the fields are separated by commas and each row begins with a name (a text format typically created by Excel), we can read in the data as follows using the read.table function
R> csvForbes2000 <- read.table("Forbes2000.csv",+ header = TRUE, sep = ",", row.names = 1)The argument header = TRUE indicates that the entries in the first line of the text file "Forbes2000.csv" should be interpreted as variable names. Columns are separated by a comma (sep = ","), users of continental versions of Excel should take care of the character symbol coding for decimal points (by default dec = "."). Finally, the first column should be interpreted as row names but not as a variable (row.names = 1). Alternatively, the function read.csv can be used to read comma-separated files. The function read.table by default guesses the class of each variable from the specified file. In our case, character variables are stored as factors
R> class(csvForbes2000[,"name"])
[1] "character"which is only suboptimal since the names of the companies are unique. However, we can supply the types for each variable to the colClasses argument
R> csvForbes2000 <- read.table("Forbes2000.csv",+ header = TRUE, sep = ",", row.names = 1,+ colClasses = c("character", "integer", "character",+ "factor", "factor", "numeric", "numeric", "numeric",+ "numeric"))R> class(csvForbes2000[,"name"])
[1] "character"and check if this object is identical to our previous Forbes 2000 list object
R> all.equal(csvForbes2000, Forbes2000)
[1] "Component \"name\": 23 string mismatches"The argument colClasses expects a character vector of length equal to the number of columns in the file. Such a vector can be supplied by the c function that combines the objects given in the parameter list into a vector
R> classes <- c("character", "integer", "character", "factor",+ "factor", "numeric", "numeric", "numeric", "numeric")R> length(classes)
[1] 9
R> class(classes)
[1] "character"
An R interface to the open data base connectivity (ODBC) standard is available in package RODBC and its functionality can be used to access Excel and Access files directly:
R> library("RODBC")R> cnct <- odbcConnectExcel("Forbes2000.xls")R> sqlQuery(cnct, "select * from \"Forbes2000\\$\"")The function odbcConnectExcel opens a connection to the specified Excel or Access file which can be used to send SQL queries to the data base engine and retrieve the results of the query.
Files in SPSS format are read in a way similar to reading comma-separated files, using the function read.spss from package foreign (which comes with the base distribution).
Exporting data from R is now rather straightforward. A comma-separated file readable by Excel can be constructed from a data.frame object via
R> write.table(Forbes2000, file = "Forbes2000.csv", sep = ",",+ col.names = NA)The function write.csv is one alternative and the functionality implemented in the RODBC package can be used to write data directly into Excel spreadsheets as well.
Alternatively, when data should be saved for later processing in R only, R objects of arbitrary kind can be stored into an external binary file via
R> save(Forbes2000, file = "Forbes2000.rda")where the extension .rda is standard. We can get the file names of all files with extension .rda from the working directory
R> list.files(pattern = "\\.rda")
[1] "Forbes2000.rda"and we can load the contents of the file into R by
R> load("Forbes2000.rda")
1.6 Basic Data Manipulation
The examples shown in the previous section have illustrated the importance of data.frames for storing and handling tabular data in R. Internally, a data.frame is a list of vectors of a common length , the number of rows of the table. Each of those vectors represents the measurements of one variable and we have seen that we can access such a variable by its name, for example the names of the companies
R> companies <- Forbes2000[,"name"]Of course, the companies vector is of class character and of length . A subset of the elements of the vector companies can be extracted using the [] subset operator. For example, the largest of the companies listed in the Forbes 2000 list is
R> companies[1]
[1] "Citigroup"and the top three companies can be extracted utilizing an integer vector of the numbers one to three:
R> 1:3
[1] 1 2 3
R> companies[1:3]
[1] "Citigroup" "General Electric"[3] "American Intl Group"In contrast to indexing with positive integers, negative indexing returns all elements that are not part of the index vector given in brackets. For example, all companies except those with numbers four to two thousand, i.e., the top three companies, are again
R> companies[-(4:2000)]
[1] "Citigroup" "General Electric"[3] "American Intl Group"
The complete information about the top three companies can be printed in a similar way. Because data.frames have a concept of rows and columns, we need to separate the subsets corresponding to rows and columns by a comma. The statement
R> Forbes2000[1:3, c("name", "sales", "profits", "assets")]
name sales profits assets1 Citigroup 94.71 17.85 1264.032 General Electric 134.19 15.59 626.933 American Intl Group 76.66 6.46 647.66extracts the variables name, sales, profits and assets for the three largest companies. Alternatively, a single variable can be extracted from a data.frame by
R> companies <- Forbes2000$namewhich is equivalent to the previously shown statement
R> companies <- Forbes2000[,"name"]
We might be interested in extracting the largest companies with respect to an alternative ordering. The three top-selling companies can be computed along the following lines. First, we need to compute the ordering of the companies’ sales
R> order_sales <- order(Forbes2000$sales)which returns the indices of the ordered elements of the numeric vector sales. Consequently the three companies with the lowest sales are
R> companies[order_sales[1:3]]
[1] "Custodia Holding" "Central European Media"[3] "Minara Resources"The indices of the three top sellers are the elements and of the integer vector order_sales
R> Forbes2000[order_sales[c(2000, 1999, 1998)],+ c("name", "sales", "profits", "assets")]
name sales profits assets10 Wal-Mart Stores 256.33 9.05 104.915 BP 232.57 10.27 177.574 ExxonMobil 222.88 20.96 166.99
Another way of selecting vector elements is the use of a logical vector being TRUE when the corresponding element is to be selected and FALSE otherwise. The companies with assets of more than billion US dollars are
R> Forbes2000[Forbes2000$assets > 1000,+ c("name", "sales", "profits", "assets")]
name sales profits assets1 Citigroup 94.71 17.85 1264.039 Fannie Mae 53.13 6.48 1019.17403 Mizuho Financial 24.40 -20.11 1115.90where the expression Forbes2000$assets > 1000 indicates a logical vector of length with
R> table(Forbes2000$assets > 1000)
FALSE TRUE 1997 3elements being either FALSE or TRUE. In fact, for some of the companies the measurement of the profits variable are missing. In R, missing values are treated by a special symbol, NA, indicating that this measurement is not available. The observations with profit information missing can be obtained via
R> na_profits <- is.na(Forbes2000$profits)R> table(na_profits)
na_profitsFALSE TRUE 1995 5
R> Forbes2000[na_profits,+ c("name", "sales", "profits", "assets")]
name sales profits assets772 AMP 5.40 NA 42.941085 HHG 5.68 NA 51.651091 NTL 3.50 NA 10.591425 US Airways Group 5.50 NA 8.581909 Laidlaw International 4.48 NA 3.98where the function is.na returns a logical vector being TRUE when the corresponding element of the supplied vector is NA. A more comfortable approach is available when we want to remove all observations with at least one missing value from a data.frame object. The function complete.cases takes a data.frame and returns a logical vector being TRUE when the corresponding observation does not contain any missing value:
R> table(complete.cases(Forbes2000))
FALSE TRUE 5 1995
Subsetting data.frames driven by logical expressions may induce a lot of typing which can be avoided. The subset function takes a data.frame as first argument and a logical expression as second argument. For example, we can select a subset of the Forbes 2000 list consisting of all companies situated in the United Kingdom by
R> UKcomp <- subset(Forbes2000, country == "United Kingdom")R> dim(UKcomp)
[1] 137 8i.e., of the companies are from the UK. Note that it is not necessary to extract the variable country from the data.frame Forbes2000 when formulating the logical expression with subset.
1.7 Computing with Data
1.7.1 Simple Summary Statistics
Two functions are helpful for getting an overview about R objects: str and summary, where str is more detailed about data types and summary gives a collection of sensible summary statistics. For example, applying the summary method to the Forbes2000 data set,
R> summary(Forbes2000)results in the following output
rank name country Min. : 1.0 Length :2000 United States :751 1st Qu.: 500.8 N.unique :2000 Japan :316 Median :1000.5 N.blank : 0 United Kingdom:137 Mean :1000.5 Min.nchar: 1 Germany : 65 3rd Qu.:1500.2 Max.nchar: 29 France : 63 Max. :2000.0 Canada : 56 (Other) :612 category sales Banking : 313 Min. : 0.010 Diversified financials: 158 1st Qu.: 2.018 Insurance : 112 Median : 4.365 Utilities : 110 Mean : 9.697 Materials : 97 3rd Qu.: 9.547 Oil & gas operations : 90 Max. :256.330 (Other) :1120 profits assets marketvalue Min. :-25.8300 Min. : 0.270 Min. : 0.02 1st Qu.: 0.0800 1st Qu.: 4.025 1st Qu.: 2.72 Median : 0.2000 Median : 9.345 Median : 5.15 Mean : 0.3811 Mean : 34.042 Mean : 11.88 3rd Qu.: 0.4400 3rd Qu.: 22.793 3rd Qu.: 10.60 Max. : 20.9600 Max. :1264.030 Max. :328.54 NAs :5From this output we can immediately see that most of the companies are situated in the US and that most of the companies are working in the banking sector as well as that negative profits, or losses, up to billion US dollars occur.
Internally, summary is a so-called generic function with methods for a multitude of classes, i.e., summary can be applied to objects of different classes and will report sensible results. Here, we supply a data.frame object to summary where it is natural to apply summary to each of the variables in this data.frame. Because a data.frame is a list with each variable being an element of that list, the same effect can be achieved by
R> lapply(Forbes2000, summary)
The members of the apply family help to solve recurring tasks for each element of a data.frame, matrix, list or for each level of a factor. It might be interesting to compare the profits in each of the categories. To do so, we first compute the median profit for each category from
R> mprofits <- tapply(Forbes2000$profits,+ Forbes2000$category, median, na.rm = TRUE)a command that should be read as follows. For each level of the factor category, determine the corresponding elements of the numeric vector profits and supply them to the median function with additional argument na.rm = TRUE. The latter one is necessary because profits contains missing values which would lead to a non-sensible result of the median function
R> median(Forbes2000$profits)
[1] NAThe three categories with highest median profit are computed from the vector of sorted median profits
R> rev(sort(mprofits))[1:3]
Oil & gas operations Drugs & biotechnology 0.35 0.35Household & personal products 0.31where rev rearranges the vector of median profits sorted from smallest to largest. Of course, we can replace the median function with mean or whatever is appropriate in the call to tapply. In our situation, mean is not a good choice, because the distributions of profits or sales are naturally skewed. Simple graphical tools for the inspection of the empirical distributions are introduced later on and in Chapter 2.
1.7.2 Customizing Analyses
In the preceding sections we have done quite complex analyses on our data using functions available from R. However, the real power of the system comes to light when writing our own functions for our own analysis tasks. Although R is a full-featured programming language, writing small helper functions for our daily work is not too complicated. We’ll study two example cases.
At first, we want to add a robust measure of variability to the location measures computed in the previous subsection. In addition to the median profit, computed via
R> median(Forbes2000$profits, na.rm = TRUE)
[1] 0.2we want to compute the inter-quartile range, i.e., the difference between the 3rd and 1st quartile. Although a quick search in the manual pages (via help("interquartile")) brings function IQR to our attention, we will approach this task without making use of this tool, but using function quantile for computing sample quantiles only.
A function in R is nothing but an object, and all objects are created equal. Thus, we ‘just’ have to assign a function object to a variable. A function object consists of an argument list, defining arguments and possibly default values, and a body defining the computations. The body starts and ends with braces. Of course, the body is assumed to be valid R code. In most cases we expect a function to return an object, therefore, the body will contain one or more return statements the arguments of which define the return values.
Returning to our example, we’ll name our function iqr. The iqr function should operate on numeric vectors, therefore it should have an argument x. This numeric vector will be passed on to the quantile function for computing the sample quartiles. The required difference between the and quartile can then be computed using diff. The definition of our function reads as follows
R> iqr <- function(x) {+ q <- quantile(x, prob = c(0.25, 0.75), names = FALSE)+ return(diff(q))+ }A simple test on simulated data from a standard normal distribution shows that our first function actually works, a comparison with the IQR function shows that the result is correct:
R> xdata <- rnorm(100)R> iqr(xdata)
[1] 1.49598
R> IQR(xdata)
[1] 1.49598However, when the numeric vector contains missing values, our function fails as the following example shows:
R> xdata[1] <- NAR> iqr(xdata)
Error in quantile.default(x, prob = c(0.25, 0.75), names = FALSE) : missing values and NaN's not allowed if 'na.rm' is FALSE
In order to make our little function more flexible it would be helpful to add all arguments of quantile to the argument list of iqr. The copy-and-paste approach that first comes to mind is likely to lead to inconsistencies and errors, for example when the argument list of quantile changes. Instead, the dot argument, a wildcard for any argument, is more appropriate and we redefine our function accordingly:
R> iqr <- function(x, ...) {+ q <- quantile(x, prob = c(0.25, 0.75), names = FALSE,+ ...)+ return(diff(q))+ }R> iqr(xdata, na.rm = TRUE)
[1] 1.503438
R> IQR(xdata, na.rm = TRUE)
[1] 1.503438
Now, we can assess the variability of the profits using our new iqr tool:
R> iqr(Forbes2000$profits, na.rm = TRUE)
[1] 0.36Since there is no difference between functions that have been written by one of the R developers and user-created functions, we can compute the inter-quartile range of profits for each of the business categories by using our iqr function inside a tapply statement;
R> iqr_profits <- tapply(Forbes2000$profits,+ Forbes2000$category, iqr, na.rm = TRUE)and extract the categories with the smallest and greatest variability
R> levels(Forbes2000$category)[which.min(iqr_profits)]
[1] "Hotels restaurants & leisure"
R> levels(Forbes2000$category)[which.max(iqr_profits)]
[1] "Drugs & biotechnology"We observe less variable profits in tourism enterprises compared with profits in the pharmaceutical industry.
As other members of the apply family, tapply is very helpful when the same task is to be done more than one time. Moreover, its use is more convenient compared to the usage of for loops. For the sake of completeness, we will compute the category-wise inter-quartile range of the profits using a for loop.
Like a function, a for loop consists of a body, i.e., a chain of R commands to be executed. In addition, we need a set of values and a variable that iterates over this set. Here, the set we are interested in is the business categories:
R> bcat <- Forbes2000$categoryR> iqr_profits2 <- numeric(nlevels(bcat))R> names(iqr_profits2) <- levels(bcat)R> for (cat in levels(bcat)) {+ catprofit <- subset(Forbes2000, category == cat)$profit+ this_iqr <- iqr(catprofit, na.rm = TRUE)+ iqr_profits2[levels(bcat) == cat] <- this_iqr+ }Compared to the usage of tapply, the above code is rather complicated. At first, we have to set up a vector for storing the results and assign the appropriate names to it. Next, inside the body of the for loop, the iqr function has to be called on the appropriate subset of all companies of the current business category cat. The corresponding inter-quartile range must then be assigned to the correct vector element in the result vector. Luckily, such complicated constructs will be used in only one of the remaining chapters of the book and are almost always avoidable in practical data analyses.
1.7.3 Simple Graphics
The degree of skewness of a distribution can be investigated by constructing histograms using the hist function. (More sophisticated alternatives such as smooth density estimates will be considered in Chapter 8.)
R> layout(matrix(1:2, nrow = 2))
R> hist(Forbes2000$marketvalue)
R> hist(log(Forbes2000$marketvalue))
For example, the code for producing Figure 1.1 first divides the plot region into two equally spaced rows (the layout function) and then plots the histograms of the raw market values in the upper part using the hist function. The lower part of the figure depicts the histogram for the log-transformed market values which appear to be more symmetric.
Bivariate relationships of two continuous variables are usually depicted as scatterplots. In R, regression relationships are specified by so-called model formulae which, in a simple bivariate case, may look like
R> fm <- marketvalue ~ salesR> class(fm)
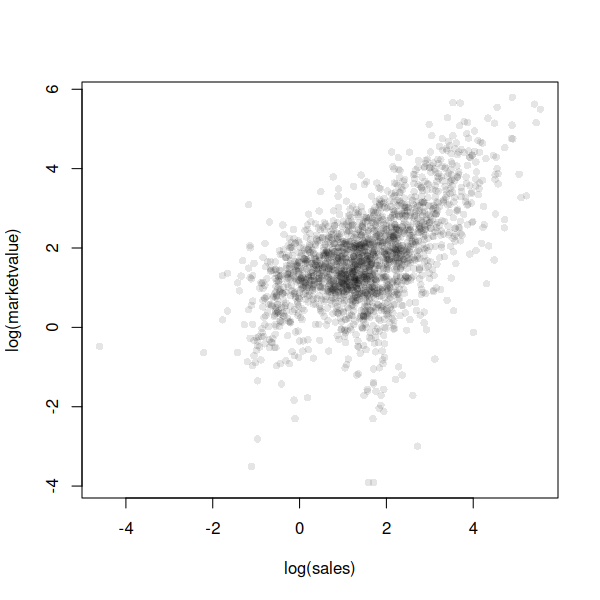
[1] "formula"with the dependent variable on the left-hand side and the independent variable on the right-hand side. The tilde separates left- and right-hand sides. Such a model formula can be passed to a model function (for example to the linear model function as explained in Chapter 6). The plot generic function implements a formula method as well. Because the distributions of both market value and sales are skewed we choose to depict their logarithms. A raw scatterplot of data points (Figure 1.2) is rather uninformative due to areas with very high density. This problem can be avoided by choosing a transparent color for the dots as shown in Figure 1.3.
R> plot(log(marketvalue) ~ log(sales), data = Forbes2000,
+ pch = ".")
R> plot(log(marketvalue) ~ log(sales), data = Forbes2000,
+ col = rgb(0,0,0,0.1), pch = 16)
If the independent variable is a factor, a boxplot representation is a natural choice. For four selected countries, the distributions of the logarithms of the market value may be visually compared in Figure 1.4. Prior to calling the plot function on our data, we have to remove empty levels from the country variable, because otherwise the -axis would show all and not only the selected countries. This task is most easily performed by subsetting the corresponding factor with additional argument drop = TRUE.
R> tmp <- subset(Forbes2000,
+ country %in% c("United Kingdom", "Germany",
+ "India", "Turkey"))
R> tmp$country <- tmp$country[,drop = TRUE]
R> plot(log(marketvalue) ~ country, data = tmp,
+ ylab = "log(marketvalue)", varwidth = TRUE)
Here, the width of the boxes are proportional to the square root of the number of companies for each country and extremely large or small market values are depicted by single points. More elaborate graphical methods will be discussed in Chapter 2.
1.8 Organizing an Analysis
Although it is possible to perform an analysis typing all commands directly on the R prompt it is much more comfortable to maintain a separate text file collecting all steps necessary to perform a certain data analysis task. Such an R transcript file, for example called analysis.R created with your favorite text editor, can be sourced into R using the source command
R> source("analysis.R", echo = TRUE)When all steps of a data analysis, i.e., data preprocessing, transformations, simple summary statistics and plots, model building and inference as well as reporting, are collected in such an R transcript file, the analysis can be reproduced at any time, maybe with corrected or updated data as it frequently happens in our consulting practice.
1.9 Summary of Findings
Data manipulation precedes every statistical analysis and is often more complex than the final model fitting and display. The R language in itself is very powerful and allows efficient data manipulation. For really large data sets that do not fit into the random access memory of the computer, we have to store the data elsewhere, for example in database systems or flat files. Packages for accessing the data from these sources are described in the ‘Large memory and out-of-memory data’ section of the ‘High-performance and parallel computing’ task view.
1.10 Final Comments
Reading data into R is possible in many different ways, including direct connections to data base engines. Tabular data are handled by data.frames in R, and the usual data manipulation techniques such as sorting, ordering or subsetting can be performed by simple R statements. An overview on data stored in a data.frame is given mainly by two functions: summary and str. Simple graphics such as histograms and scatterplots can be constructed by applying the appropriate R functions (hist and plot) and we shall give many more examples of these functions and those that produce more interesting graphics in later chapters.
Exercises
-
Ex. 1.1 Calculate the median profit for the companies in the US and the median profit for the companies in the UK, France, and Germany.
-
Ex. 1.2 Find all German companies with negative profit.
-
Ex. 1.3 To which business category do most of the Bermuda island companies belong?
-
Ex. 1.4 For the companies in the Forbes data set with the highest profits, plot sales against assets (or some suitable transformation of each variable), labeling each point with the appropriate country name which may need to be abbreviated (using abbreviate) to avoid making the plot look too ‘messy’.
-
Ex. 1.5 Find the average value of sales for the companies in each country in the Forbes data set, and find the number of companies in each country with profits above billion US dollars.
-
Ex. 1.6 List all the products made by companies in the UK.
-
Ex. 1.7 Plot sales against market value for companies in the UK and in Germany using different plotting symbols for the two countries.
-
Ex. 1.8 For the ten companies in the UK with the greatest profits construct a bar chart of profits labeled with the companies’ name.
-
Ex. 1.9 How many of the companies with the greatest market value are from the US and how many are from the UK?
-
Ex. 1.10 Construct a histogram of profits for all companies in Germany with assets above three billion dollars; how many such companies are there? And which product does the company with the greatest profit make?
References
- The new S language. Chapman & Hall, London, UK. Cited by: §1.1.
- Statistical models in S. Chapman & Hall, London, UK. Cited by: §1.1.
- Programming with data. Springer-Verlag, New York, USA. Cited by: §1.1.
- Introductory statistics with r. Springer-Verlag, New York, USA. Cited by: §1.3.
- Reproducible research: A bioinformatics case study. Statistical Applications in Genetics and Molecular Biology 4 (1). Note: Article 2 Cited by: §1.3.
- Sweave, Part II: package vignettes. R News 3 (2), pp. 21–24. External Links: Link Cited by: §1.3.
- R graphics. Chapman & Hall/CRC, Boca Raton, Florida, USA. Cited by: §1.3.
- An introduction to r. R Foundation for Statistical Computing, Vienna, Austria. External Links: Link Cited by: §1.3.
- R data import/export. R Foundation for Statistical Computing, Vienna, Austria. External Links: Link Cited by: §1.3.
- R installation and administration. R Foundation for Statistical Computing, Vienna, Austria. External Links: Link Cited by: §1.3.
- Writing r extensions. R Foundation for Statistical Computing, Vienna, Austria. External Links: Link Cited by: §1.3.
- Modern applied statistics with S. 4th edition, Springer-Verlag, New York, USA. Note: ISBN 0-387-95457-0 External Links: Link Cited by: §1.3.
- Econometric computing with HC and HAC covariance matrix estimators. Journal of Statistical Software 11 (10), pp. 1–17. External Links: Link Cited by: §1.2.2.