Datasets provided for spatstat
This document is an overview of the spatial datasets that are provided for the spatstat package.
To flick through a nice display of all the data sets that come with spatstat type demo(data). To see information about a given data set, type help(name) where name is the name of the data set. To plot a given data set, type plot(name). A nicer plot will often be produced by typing example(name).
Datasets in spatstat are “lazy-loaded”, which means that they can be accessed simply by typing their name. Not all packages do this; in some packages you have to type data(name) in order to access a data set.
To list all the datasets in spatstat, you need to type data(package="spatstat.data"). This is because, for efficiency, the datasets are actually installed in a sub-package spatstat.data. This is the only time you should ever need to mention spatstat.data explicitly. When the spatstat package is loaded by the command library(spatstat), the sub-package spatstat.data is automatically loaded.
1 List of datasets
1.1 Point patterns in 2D
Here is a list of the standard point pattern data sets that are supplied with the current installation of spatstat.data.
The shape of the window containing the point pattern
is indicated by the symbols (rectangle),
(disc), 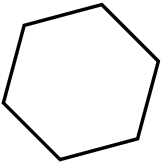 (convex polygon), (irregular polygon)
and
 (binary mask).
| name | description | marks | covariates | window |
| amacrine | rabbit amacrine cells | cell type | ||
| anemones | sea anemones | diameter | ||
| ants | ant nests | species | zones | |
| bdspots | breakdown spots | |||
| bei | rainforest trees | topography | ||
| betacells | cat retinal ganglia | cell type, area | ||
| bramblecanes | bramble canes | age | ||
| bronzefilter | bronze particles | diameter | ||
| btb | bovine tuberculosis | type, year | ||
| cells | biological cells | |||
| chorley | cancers | case/control | ||
| clmfires | forest fires | cause, size, date | elevation, orientation, slope, land use | |
| concrete | air bubbles in concrete | | ||
| copper | copper deposits | fault lines | ||
| demopat | artificial data | type | ||
| finpines | trees | diam, height | ||
| gordon | people in a park | |||
| gorillas | gorilla nest sites | group, season | terrain, vegetation, heat, water | |
| hamster | hamster tumour cells | cell type | ||
| humberside | child leukaemia | case/control | ||
| hyytiala | mixed forest | species | ||
| japanesepines | Japanese pines | |||
| lansing | mixed forest | species | ||
| longleaf | trees | diameter | ||
| meningitis | disease cases | serotype | population density | |
| mucosa | gastric mucosa cells | cell type | ||
| murchison | gold deposits | faults, rock type | ||
| nbfires | wildfires | several | ||
| nztrees | trees | |||
| paracou | trees | adult/juvenile | ||
| ponderosa | trees | |||
| redwood | saplings | |||
| redwood3 | saplings | |||
| redwoodfull | saplings | zones | ||
| shapley | galaxies | magnitude, recession, SE | | |
| shelling | artillery impacts | |||
| simdat | simulated pattern | |||
| sporophores | fungi | species | ||
| spruces | trees | diameter | ||
| stonetools | palaeolithic tools | type, depth | ||
| swedishpines | trees | |||
| urkiola | mixed forest | species | ||
| vesicles | synaptic vesicles | zones | ||
| waka | trees | diameter |
Auxiliary information
Additional information about a point pattern data set name may be stored in a separate list name.extra. Currently these are the auxiliary data sets:
| Name | Contents |
|---|---|
| ants.extra | field and scrub subregions; |
| additional map elements; plotting function | |
| bei.extra | covariate images |
| chorley.extra | incinerator location; plotting function |
| gorillas.extra | covariate images |
| nbfires.extra | inscribed rectangle; border type labels |
| ponderosa.extra | data points of interest; plotting function |
| redwoodfull.extra | subregions; plotting function |
| shapley.extra | individual survey fields; plotting function |
| vesicles.extra | anatomical regions |
Additionally, raw data files are available for the datasets amacrine, finpines, gorillas, vesicles and gorillas. See the help files for these datasets for information about the raw data files.
1.2 Other Spatial Data Types
There are also the following spatial data sets which are not 2D point patterns:
| name | description | class | format |
|---|---|---|---|
| austates | Australian states | tess | tessellation |
| cetaceans | marine survey | hyperframe | replicated 2D point patterns |
| chicago | crimes | lpp | point pattern on linear network |
| demohyper | simulated data | hyperframe | replicated 2D point patterns with covariates |
| dendrite | dendritic spines | lpp | point pattern on linear network |
| flu | virus proteins | hyperframe | replicated 2D point patterns |
| heather | heather mosaic | solist | binary image (three versions) |
| osteo | osteocyte lacunae | hyperframe | replicated 3D point patterns with covariates |
| pyramidal | pyramidal neurons | hyperframe | replicated 2D point patterns in 3 groups |
| residualspaper | data & code | list | 2D point patterns, R function |
| simba | simulated data | hyperframe | replicated 2D point patterns in 2 groups |
| spiders | spider webs | lpp | point pattern on linear network |
| waterstriders | insects on water | solist | replicated 2D point patterns |
Additionally there is a dataset Kovesi containing several colour maps with perceptually uniform contrast.
Raw data files are available for the osteo dataset. See the help for osteo for information.
2 Information on each dataset
Here we give basic information about each dataset. For further information, consult the help file for the particular dataset.
amacrine: Amacrine cells
Locations of displaced amacrine cells in the retina of a rabbit. There are two types of points, “on” and “off”.
> plot(amacrine)
anemones: Sea Anemones
These data give the spatial locations and diameters of sea anemones on a boulder near sea level.
> plot(anemones, markscale=1)
ants: Ants’ nests
Spatial locations of nests of two species of ants at a site in Greece. The full dataset (supplied here) has an irregular polygonal boundary, while most analyses have been confined to two rectangular subsets of the pattern (also supplied here).
> ants.extra$plotit()
austates: Australian states
The states and large mainland territories of Australia are represented as polygonal regions forming a tessellation.
> plot(austates)
bdspots: Breakdown spots
A list of three point patterns, each giving the locations of electrical breakdown spots on a circular electrode in a microelectronic capacitor.
> plot(bdspots, equal.scales=TRUE, pch="+",+ panel.args=function(i)list(cex=c(0.15, 0.2, 0.7)[i]))
bei: Beilschmiedia data
Locations of 3605 trees in a tropical rain forest. Accompanied by covariate data giving the elevation (altitude) and slope of elevation in the study region.
> plot(bei.extra$elev, main="Beilschmiedia")> plot(bei, add=TRUE, pch=16, cex=0.3)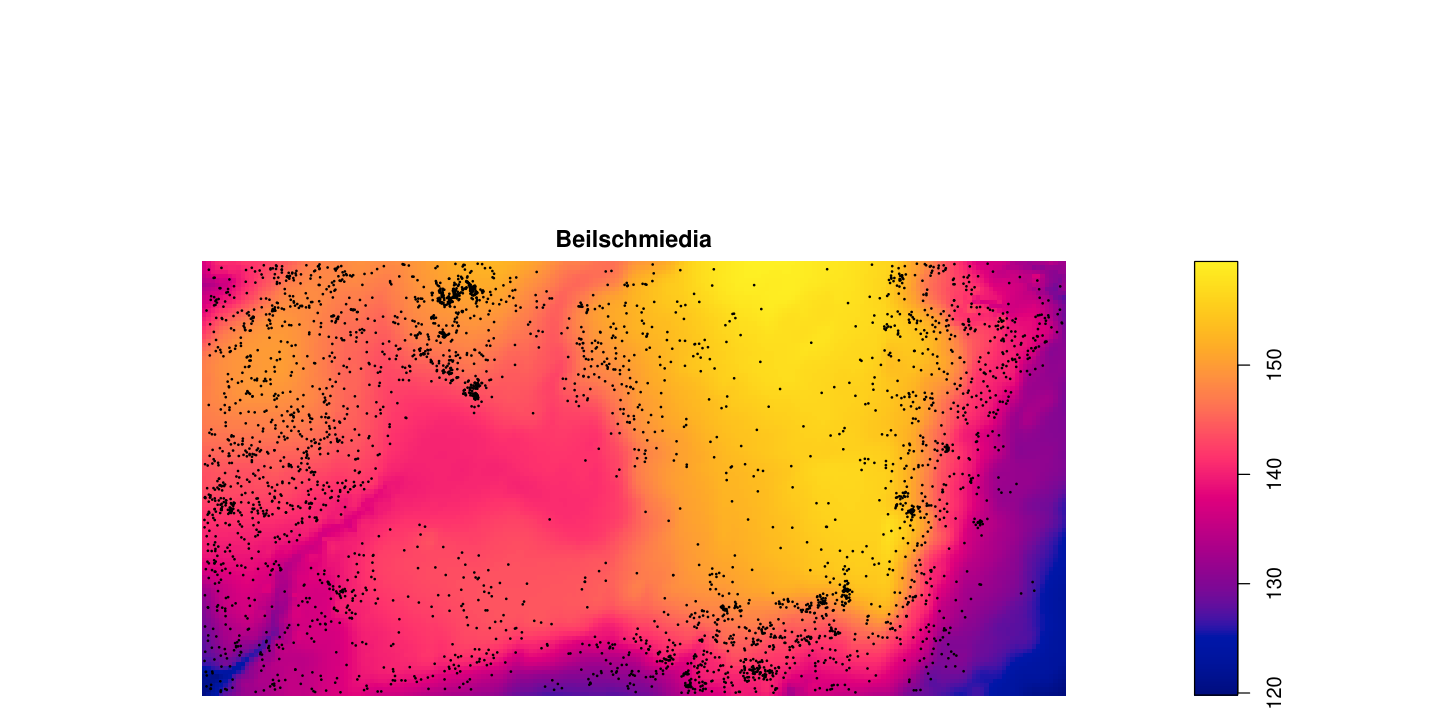
The following command gives a perspective display similar to the front cover of Baddeley, Rubak and Turner (2015):
> M <- persp(bei.extra$elev,+ theta=-45, phi=18, expand=7,+ border=NA, apron=TRUE, shade=0.3,+ box=FALSE, visible=TRUE,+ main="")> perspPoints(bei, Z=bei.extra$elev, M=M, pch=16, cex=0.3)
betacells: Beta ganglion cells
Locations of beta ganglion cells in cat retina, each cell classified as ‘on’ or ‘off’ and also labelled with the cell profile area.
> plot(betacells)
bramblecanes: Bramble canes
> plot(bramblecanes, cols=1:3)
Try the following
> plot(split(bramblecanes))
bronzefilter: Bronze filter section profiles
Spatially inhomogeneous pattern of circular section profiles of particles, observed in a longitudinal plane section through a gradient sinter filter made from bronze powder.
> plot(bronzefilter,markscale=2)
btb: bovine tuberculosis
Locations of farms where bovine tuberculosis was detected, marked by year of detection and spoligotype of tuberculosis.
> plot(btb, which.marks="spoligotype", cols=2:5, chars=1:4)
cells: Biological cells
Locations of the centres of 42 biological cells observed under optical microscopy in a histological section. Often used as a demonstration example.
> plot(cells)
cetaceans: Survey of marine species
Recorded sightings of whales, dolphins and other marine species in a series of surveys. Replicated 2D marked point patterns.
> plot(cetaceans.extra$patterns, main="Cetaceans data", cols=1:5, hsep=1)
chicago: Chicago crimes
Locations (street addresses) of crimes reported in a two-week period in an area close to the University of Chicago. A multitype point pattern on a linear network.
> plot(chicago, main="Chicago Crimes", col="grey",+ cols=c("red", "blue", "black", "blue", "red", "blue", "blue"),+ chars=c(16,2,22,17,24,15,6), leg.side="left", show.window=FALSE)
chorley: Chorley-Ribble cancer data
Spatial locations of cases of cancer of the larynx and cancer of the lung, and the location of a disused industrial incinerator. A marked point pattern, with an irregular window and a simple covariate.
> chorley.extra$plotit()
clmfires: Castilla-La Mancha Fires
Forest fires in the Castilla-La Mancha region of Spain between 1998 and 2007. A point pattern with 4 columns of marks:
| cause | cause of fire |
| burnt.area | total area burned, in hectares |
| date | date of fire |
| julian.date | date of fire in days since 1.1.1998 |
> plot(clmfires, which.marks="cause", cols=2:5, cex=0.25,+ main="Castilla-La Mancha forest fires")
The accompanying dataset clmfires.extra is a list of two items clmcov100 and clmcov200 containing covariate information for the entire Castilla-La Mancha region. Each of these two elements is a list of four pixel images named elevation, orientation, slope and landuse.
> plot(clmfires.extra$clmcov100$elevation, main="Elevation")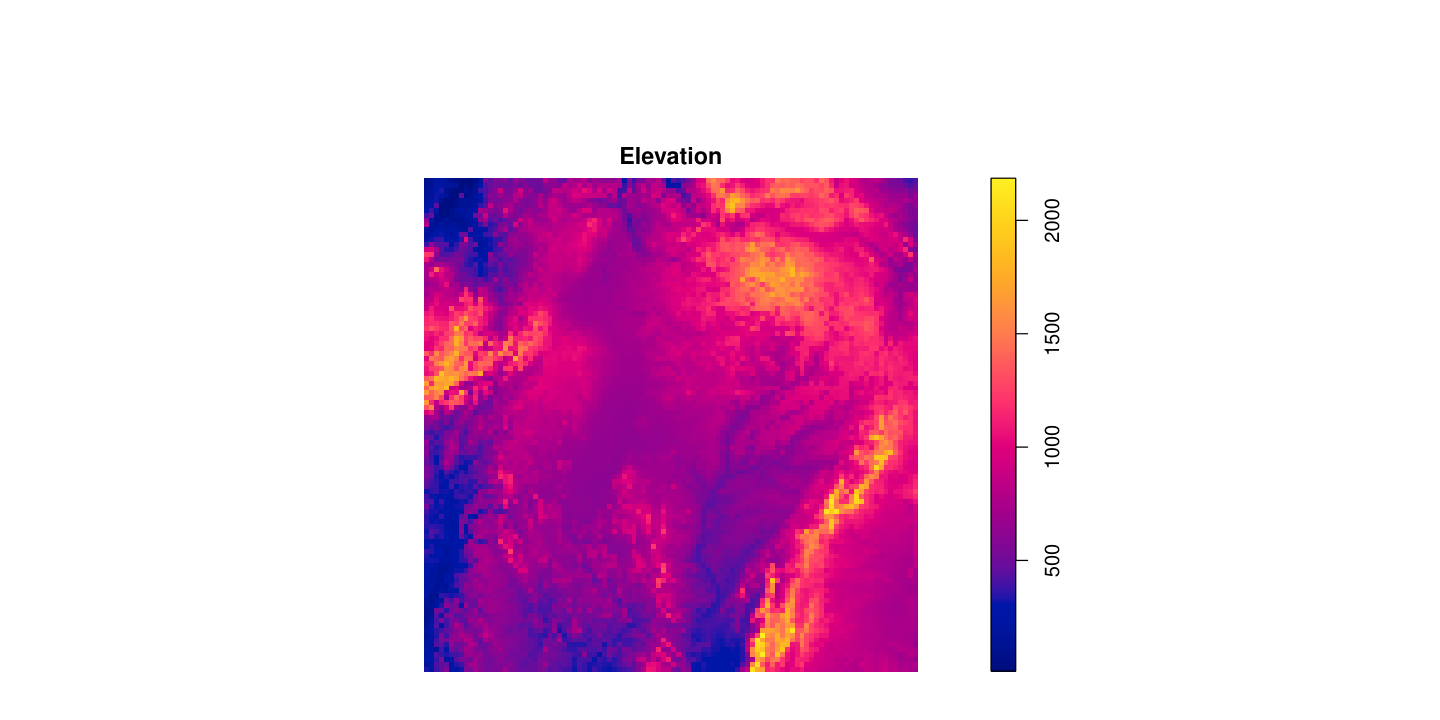
concrete: Air bubbles in concrete
Prof. Shin-ichi Igarashi’s data: a point pattern of the locations of centroids of air bubbles seen in a cross-section of concrete. Air bubbles are present in the matrix of cement paste which surrounds the particles of aggregate. The outline of the aggregate, and the locations of the centroids of the bubble profiles, are recorded.
> plot(concrete,chars="+",cols="blue",col="yellow")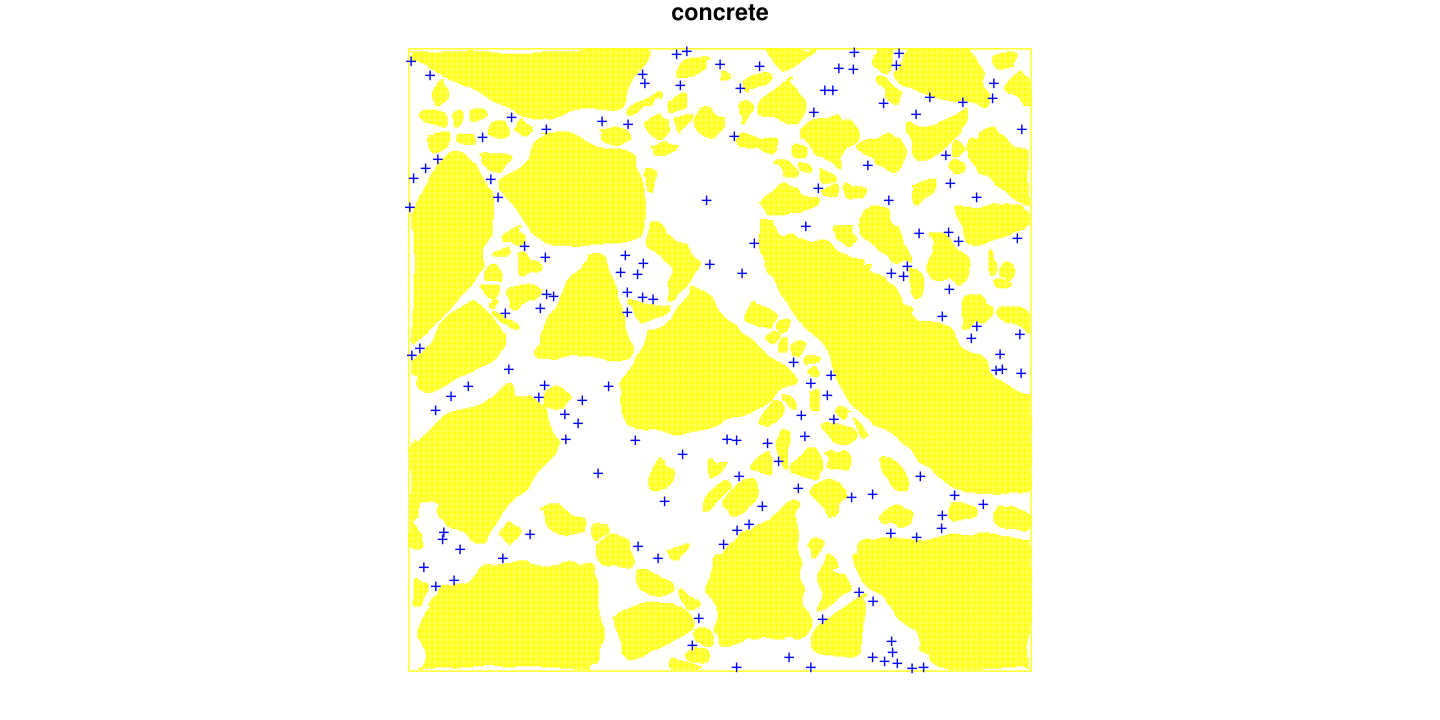
copper: Queensland copper data
These data come from an intensive geological survey in central Queensland, Australia. They consist of 67 points representing copper ore deposits, and 146 line segments representing geological ‘lineaments’, mostly faults.
> plot(copper$Points, main="Copper")> plot(copper$Lines, add=TRUE)
demohyper
A synthetic example of a hyperframe for demonstration purposes.
> plot(demohyper, quote({ plot(Image, main=""); plot(Points, add=TRUE) }),+ parargs=list(mar=rep(1,4)))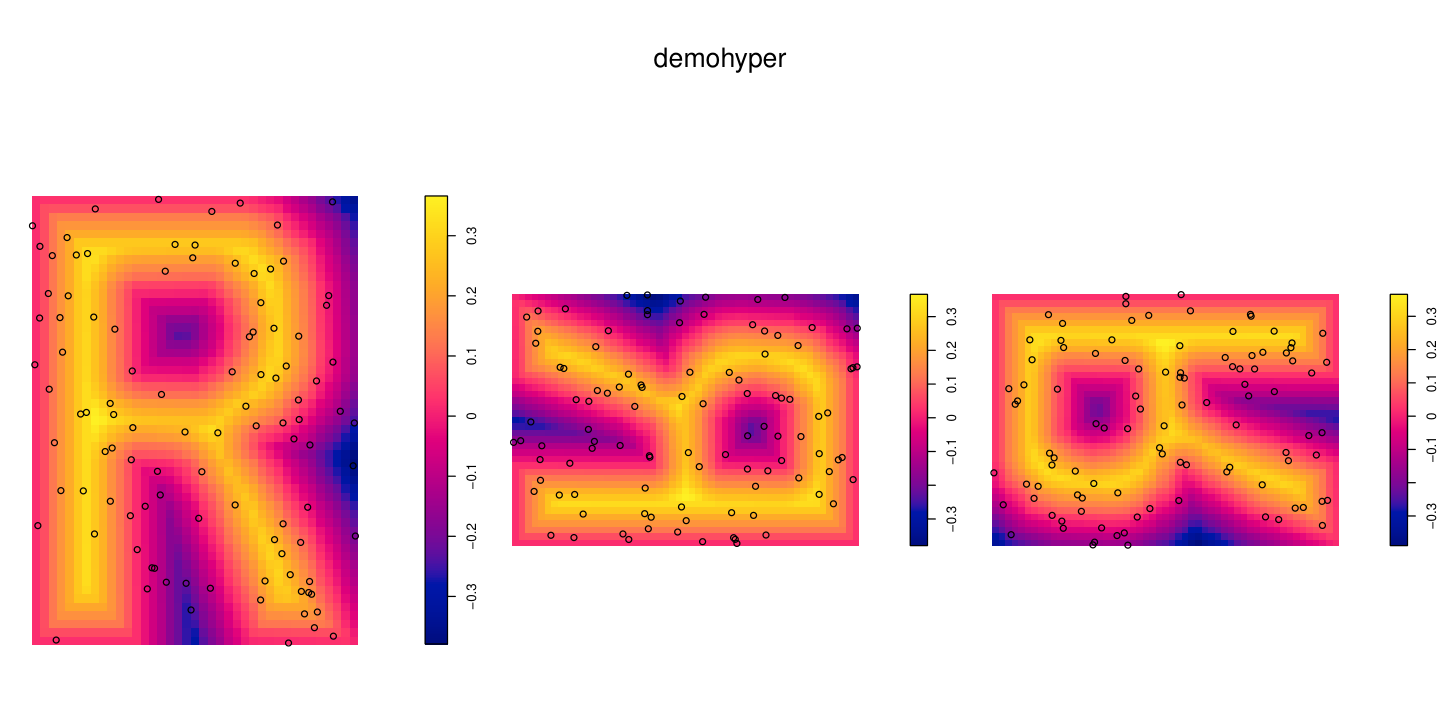
demopat
A synthetic example of a point pattern for demonstration purposes.
> plot(demopat)
dendrite
Dendrites are branching filaments which extend from the main body of a neuron (nerve cell) to propagate electrochemical signals. Spines are small protrusions on the dendrites.
This dataset gives the locations of 566 spines observed on one branch of the dendritic tree of a rat neuron. The spines are classified according to their shape into three types: mushroom, stubby or thin.
> plot(dendrite, leg.side="bottom", main="", cex=0.75, cols=2:4)
finpines: Finnish pine saplings
Locations of 126 pine saplings in a Finnish forest, their heights and their diameters.
> plot(finpines, main="Finnish pines")
flu: Influenza virus proteins
The flu dataset contains replicated spatial point patterns giving the locations of two different virus proteins on the membranes of cells infected with influenza virus.
It is a hyperframe containing point patterns and explanatory variables.
> wildM1 <- with(flu, virustype == "wt" & stain == "M2-M1")> plot(flu[wildM1, 1, drop=TRUE],+ main=c("flu data", "wild type virus, M2-M1 stain"),+ chars=c(16,3), cex=0.4, cols=2:3)
gordon: People in Gordon Square
Locations of people sitting on a grass patch on a sunny afternoon.
> plot(gordon, main="People in Gordon Square", pch=16)
gorillas: Gorilla nesting sites
Locations of nesting sites of gorillas, and associated covariates, in a National Park in Cameroon.
gorillas is a marked point pattern (object of class "ppp") representing nest site locations.
gorillas.extra is a named list of 7 pixel images (objects of class "im") containing spatial covariates. It also belongs to the class "listof".
> plot(gorillas, which.marks=1, chars=c(1,3), cols=2:3, main="Gorilla nest sites")
The vegetation covariate is also available as a raw ASCII format file,
> system.file("rawdata/gorillas/vegetation.asc", package="spatstat")
hamster: Hamster kidney cells
Cell nuclei in hamster kidney, each nucleus classified as either ‘dividing’ or ‘pyknotic’. A multitype point pattern.
> plot(hamster, cols=c(2,4))
heather: Heather mosaic
The spatial mosaic of vegetation of the heather plant, recorded in a 10 by 20 metre sampling plot in Sweden. A list with three entries, representing the same data at different spatial resolutions.
> plot(heather$coarse)
Type the following to see all three images:
> plot(heather)
humberside: Childhood Leukemia and Lymphoma
Spatial locations of cases of childhood leukaemia and lymphoma, and randomly-selected controls, in North Humberside. A marked point pattern.
> plot(humberside)
The dataset humberside.convex is an object of the same format, representing the same point pattern data, but contained in a larger, 5-sided convex polygon.
hyytiala: Mixed forest
Spatial locations and species classification for trees in a Finnish forest.
> plot(hyytiala, cols=2:5)
japanesepines: Japanese black pine saplings
Locations of Japanese black pine saplings in a square sampling region in a natural forest. Often used as a standard example.
> plot(japanesepines)
lansing: Lansing Woods
Locations and botanical classification of trees in a forest. A multitype point pattern with 6 different types of points. Includes duplicated points.
> plot(lansing)
Type the following to see 6 plots, each showing the location of one of the types of points:
> plot(split(lansing))
longleaf: Longleaf Pines
Locations and diameters of Longleaf pine trees.
> plot(longleaf)
meningitis: Meningitis Cases
Spatial locations of cases of invasive meningitis in Germany, labelled by serotype. Auxiliary data gives average population density in each administrative district.
> pa <- function(i) {+ if(i == 1) list(cols=c("red", "green")) else+ list(do.col=TRUE, col=grey(seq(1,0,length=32)))+ }> plot(meningitis, panel.args=pa)
mucosa: Gastric Mucosa Cells
A bivariate inhomogeneous point pattern, giving the locations of the centres of two types of cells in a cross-section of the gastric mucosa of a rat.
> plot(mucosa, chars=c(1,3), cols=c("red", "green"))> plot(mucosa.subwin, add=TRUE, lty=3)
murchison: Murchison Gold Deposits
Spatial locations of gold deposits and associated geological features in the Murchison area of Western Australia. A list of three elements:
- •
gold, the point pattern of gold deposits;
- •
faults, the line segment pattern of geological faults;
- •
greenstone, the subregion of greenstone outcrop.
Type the following to see the full Murchison dataset:
> plot(murchison$greenstone, main="Murchison data", col="lightgreen")> plot(murchison$gold, add=TRUE, pch=3, col="blue")> plot(murchison$faults, add=TRUE, col="red")
Some analysis of the data uses a rectangle close to the abandoned town of Reedy:
> reedy <- owin(c(580, 650) * 1000, c(6986, 7026) * 1000)
Here are the data in that area:
> plot(murchison$greenstone[reedy],+ main="Detail around Reedy township",+ col="lightgreen")> plot(murchison$gold[reedy], add=TRUE, pch=3, col="blue")> plot(murchison$faults[reedy], add=TRUE, col="red")
nbfires: New Brunswick Fires
Fires in New Brunswick (Canada) with marks giving information about each fire.
> plot(nbfires, use.marks=FALSE, pch=".")
The following command would show the data for each year in a separate panel:
> plot(split(nbfires), use.marks=FALSE, chars=".")
> par(mar=c(0,0,2,0))> plot(split(nbfires)$"2000", which.marks="fire.type",+ main=c("New Brunswick fires 2000", "by fire type"),+ cols=c("blue", "green", "red", "cyan"),+ leg.side="left")
nztrees: New Zealand Trees
Locations of trees in a forest plot in New Zealand. Often used as a demonstration example.
> plot(nztrees)> plot(trim.rectangle(as.owin(nztrees), c(0,5), 0), add=TRUE, lty=3)
osteo: Osteocyte Lacunae
Replicated three-dimensional point patterns: the three-dimensional locations of osteocyte lacunae observed in rectangular volumes of solid bone using a confocal microscope. A hyperframe containing 3D point patterns and explanatory variables.
> plot(osteo[1:4,], main.panel="", pch=21, bg='white')
For demonstration and instruction purposes, the raw data from the 36th point pattern are available in a plain ascii file in the spatstat installation,
> system.file("rawdata/osteo/osteo36.txt", package="spatstat")
paracou: Kimboto trees
Point pattern of adult and juvenile Kimboto trees recorded at Paracou in French Guiana. A bivariate point pattern.
> plot(paracou, cols=2:3, chars=c(16,3))
ponderosa: Ponderosa Pines
Locations of Ponderosa Pine trees in a forest. Several special points are identified.
> ponderosa.extra$plotit()
pyramidal: Pyramidal Neurons in Brain
Locations of pyramidal neurons in sections of human brain. There is one point pattern from each of 31 human subjects. The subjects are divided into three groups: controls (12 subjects), schizoaffective (9 subjects) and schizophrenic (10 subjects).
To reduce space, we show only the odd-numbered patterns:
> pyr <- pyramidal[c(FALSE,TRUE), ]
> pyr$grp <- abbreviate(pyr$group, minlength=7)> plot(pyr, quote(plot(Neurons, pch=16, main=grp)), main="Pyramidal Neurons")
redwood, redwood3, redwoodfull: Redwood seedlings and saplings
California Redwood seedlings and saplings in a forest. There are two versions of this dataset: redwood and redwoodfull.
The redwoodfull dataset is the full data. It is spatially inhomogeneous in density and spacing of points.
The redwood dataset is a subset of the full data, selected because it is apparently homogeneous, and has often been used as a demonstration example. This comes in two versions commonly used in the literature: redwood (coordinates given to 2 decimal places) and redwood3 (coordinates given to 3 decimal places).
> plot(redwood)> plot(redwood3, add=TRUE, pch=20)
> redwoodfull.extra$plotit()
residualspaper: Data from residuals paper
Contains the point patterns used as examples in
A. Baddeley, R. Turner, J. Møller and M. Hazelton (2005) Residual analysis for spatial point processes. Journal of the Royal Statistical Society, Series B 67, 617–666
along with R code.
> plot(as.solist(residualspaper[c("Fig1", "Fig4a", "Fig4b", "Fig4c")]),+ main="")
shapley: Shapley Galaxy Concentration
Sky positions of 4215 galaxies in the Shapley Supercluster (mapped by radioastronomy).
> shapley.extra$plotit(main="Shapley")
shelling: Artillery shell impacts
Spatial locations of artillery shell impacts in a field in Ukraine.
> plot(shelling, pch=3)> plot(onearrow(830, 400, 830, 530, "N"), add=TRUE)
simdat: Simulated data
Another simulated dataset used for demonstration purposes.
> plot(simdat)
spiders: Spider webs
Spider webs across the mortar lines of a brick wall. A point pattern on a linear network.
> plot(spiders, pch=16, show.window=FALSE)
sporophores: Sporophores
Sporophores of three species of fungi around a tree.
> plot(sporophores, chars=c(16,1,2), cex=0.6)> points(0,0,pch=16, cex=2)> text(15,8,"Tree", cex=0.75)
stonetools: Palaeolithic stone tools and bone fragments
Palaeolithic tools and bone fragments uncovered in an archaeological dig in Tanzania. Each find is marked by its type (either BONE or LITHIC) and by the height (above a reference level) of the location in the soil where it was found.
> plot(stonetools, which.marks=2, cols=c(2,3), chars=c(1,3), cex=0.5)
spruces: Spruces in Saxony
Locations of Norwegian spruce trees in a natural forest stand in Saxonia, Germany. Each tree is marked with its diameter at breast height.
> plot(spruces, maxsize=min(nndist(spruces)))
swedishpines: Swedish Pines
Locations of pine saplings in a Swedish forest. Often used as a demonstration example.
> plot(swedishpines)
urkiola: trees in a wood
Locations of birch and oak trees in a secondary wood in Urkiola Natural Park (Basque country, northern Spain). Irregular window, bivariate point pattern.
> plot(urkiola, cex=0.5, cols=2:3)
waka: trees in Waka National Park
Spatial coordinates of each tree, marked by the tree diameter at breast height.
> par(mar=c(0,0,2,0))> plot(waka, markscale=0.04, main=c("Waka national park", "tree diameters"))
vesicles: synaptic vesicles
Point pattern of synaptic vesicles observed in rat brain tissue.
> v <- rotate(vesicles, pi/2)> ve <- lapply(vesicles.extra, rotate, pi/2)> plot(v, main="Vesicles")> plot(ve$activezone, add=TRUE, lwd=3)
The auxiliary dataset vesicles.extra is a list with entries
presynapse
outer polygonal boundary of presynapse
mitochondria
polygonal boundary of mitochondria
mask
binary mask representation of vesicles window
activezone
line segment pattern representing the active zone.
For demonstration and training purposes,
the raw data files for this dataset are also
provided in the spatstat package installation:
vesicles.txt
spatial locations of vesicles
presynapse.txt
vertices of presynapse
mitochondria.txt
vertices of mitochondria
vesiclesimage.tif
greyscale microscope image
vesiclesmask.tif
binary image of mask
activezone.txt
coordinates of activezone
The files are in the folder rawdata/vesicles in the
spatstat installation directory. The precise location of the
files can be obtained using system.file, for example
> system.file("rawdata/vesicles/mitochondria.txt", package="spatstat")
waterstriders: Insects on a pond
Three independent replications of a point pattern formed by insects on the surface of a pond.
> plot(waterstriders)